
Dogecoin dropped sharply in Thursday’s session, with sellers maintaining control despite a brief attempt to hold the $0.10 psychological level. The popular meme coin currently trades at $0.09783, down 3.68% over the past 24 hours, as short-term bearish pressure continues to weigh on price action.

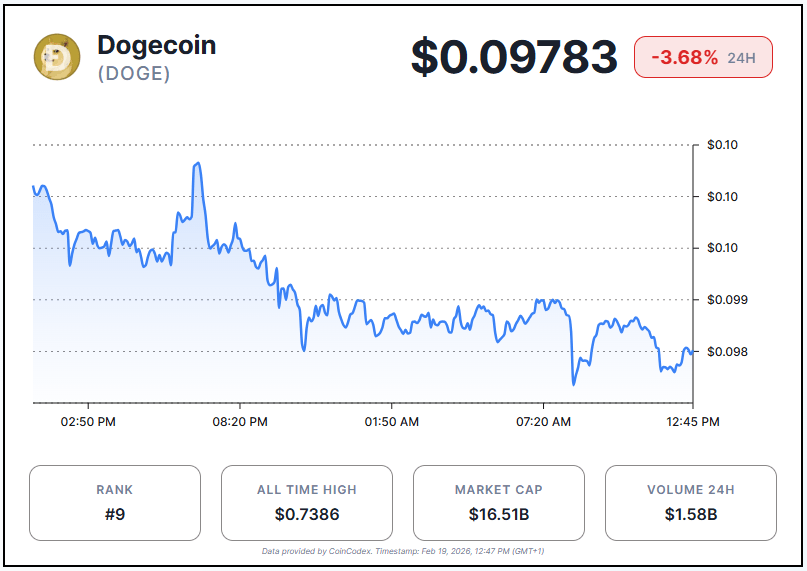
The 24-hour trading range stretched from $0.09718 to $0.102. DOGE pushed toward the upper boundary early in the session but gradually retreated, settling near the lower half of its daily range. Despite the intraday weakness, the token still holds a 5.42% gain over the past seven days, a sign that buying interest remains present at lower levels.
Broader performance, however, tells a different story. DOGE has shed 22.4% over the past 30 days and remains 60.6% lower year-over-year. These figures underscore the persistent downward pressure that has characterized the asset for much of the past year.
Technical Indicators Point to Bearish Momentum
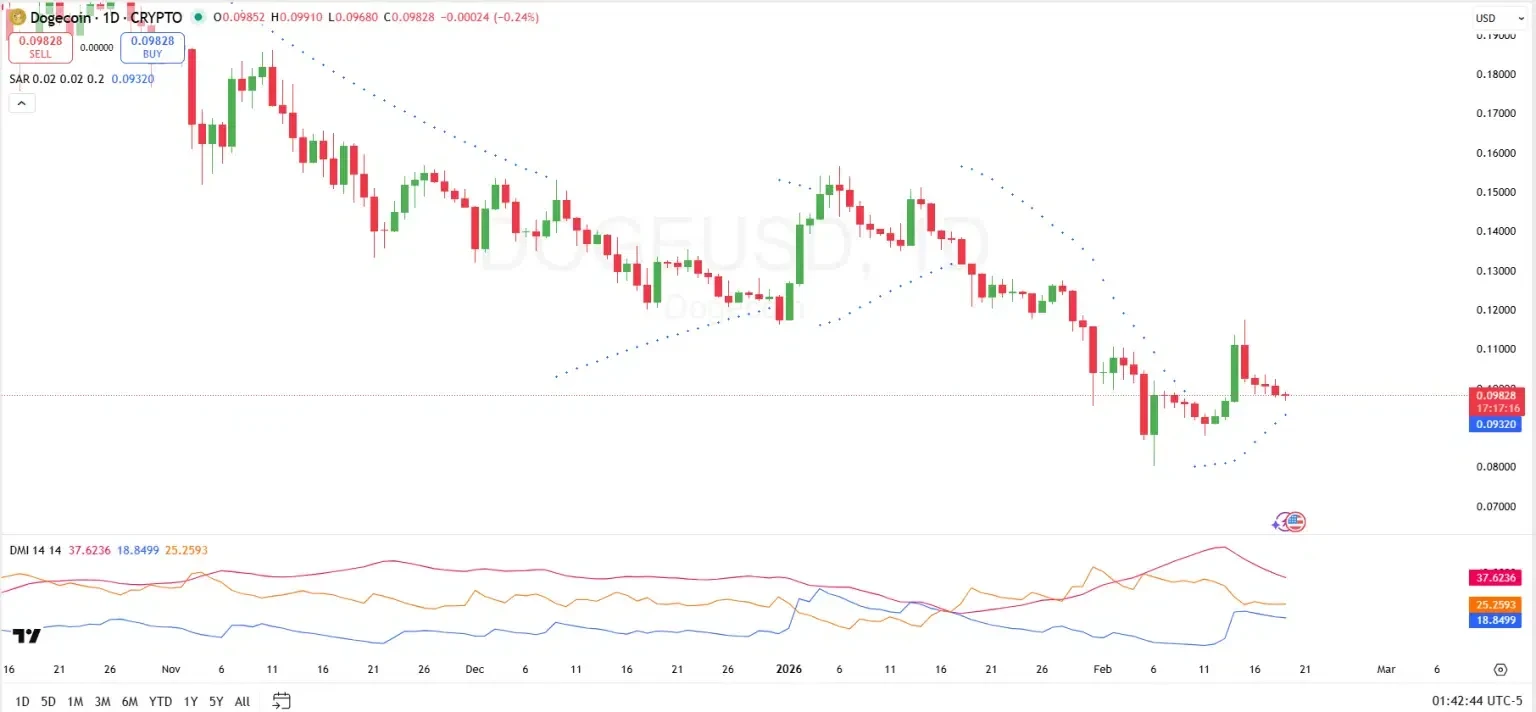
The Directional Movement Index paints a cautious picture. The negative directional indicator (-DI) sits at approximately 37.6, well above the positive directional indicator (+DI) at 18.8. This wide gap confirms that sellers hold a firm advantage. The ADX reading near 25 suggests a declining trend remains in place, though the reading is not extreme.
For a bullish reversal to gain credibility, the +DI must cross above the -DI while the ADX rises simultaneously. That combination would confirm momentum shifting in favor of buyers. Neither condition has been met yet.
One contrasting signal comes from the Parabolic SAR. The indicator’s dots have flipped below the price candles, a development that typically signals building upward momentum. This suggests DOGE may be attempting a short-term relief rally, even if the broader trend remains bearish. Traders often treat this signal as an early warning of a possible trend shift, though confirmation from other indicators is essential before acting.
Key support sits in the $0.085–$0.090 range, a zone where buyers previously stepped in to defend the dip. A clean break below $0.085 would open the door toward $0.080. On the upside, resistance clusters between $0.111 and $0.117, with a stronger ceiling near $0.125, a level tied to prior breakdown points and previous lower highs.
Analyst Flags Cup-and-Handle Formation
Crypto analyst Trader Tardigrade, posting on X, identified a cup-and-handle pattern forming on Dogecoin’s daily chart. The setup is widely regarded as a bullish continuation signal in technical analysis.
According to the analyst, DOGE has already completed the rounded cup portion of the pattern. The asset bottomed near $0.08 before rallying to roughly $0.11, carving out the curved base characteristic of the formation. The handle phase, a period of consolidation near the prior high, appears to be developing now.
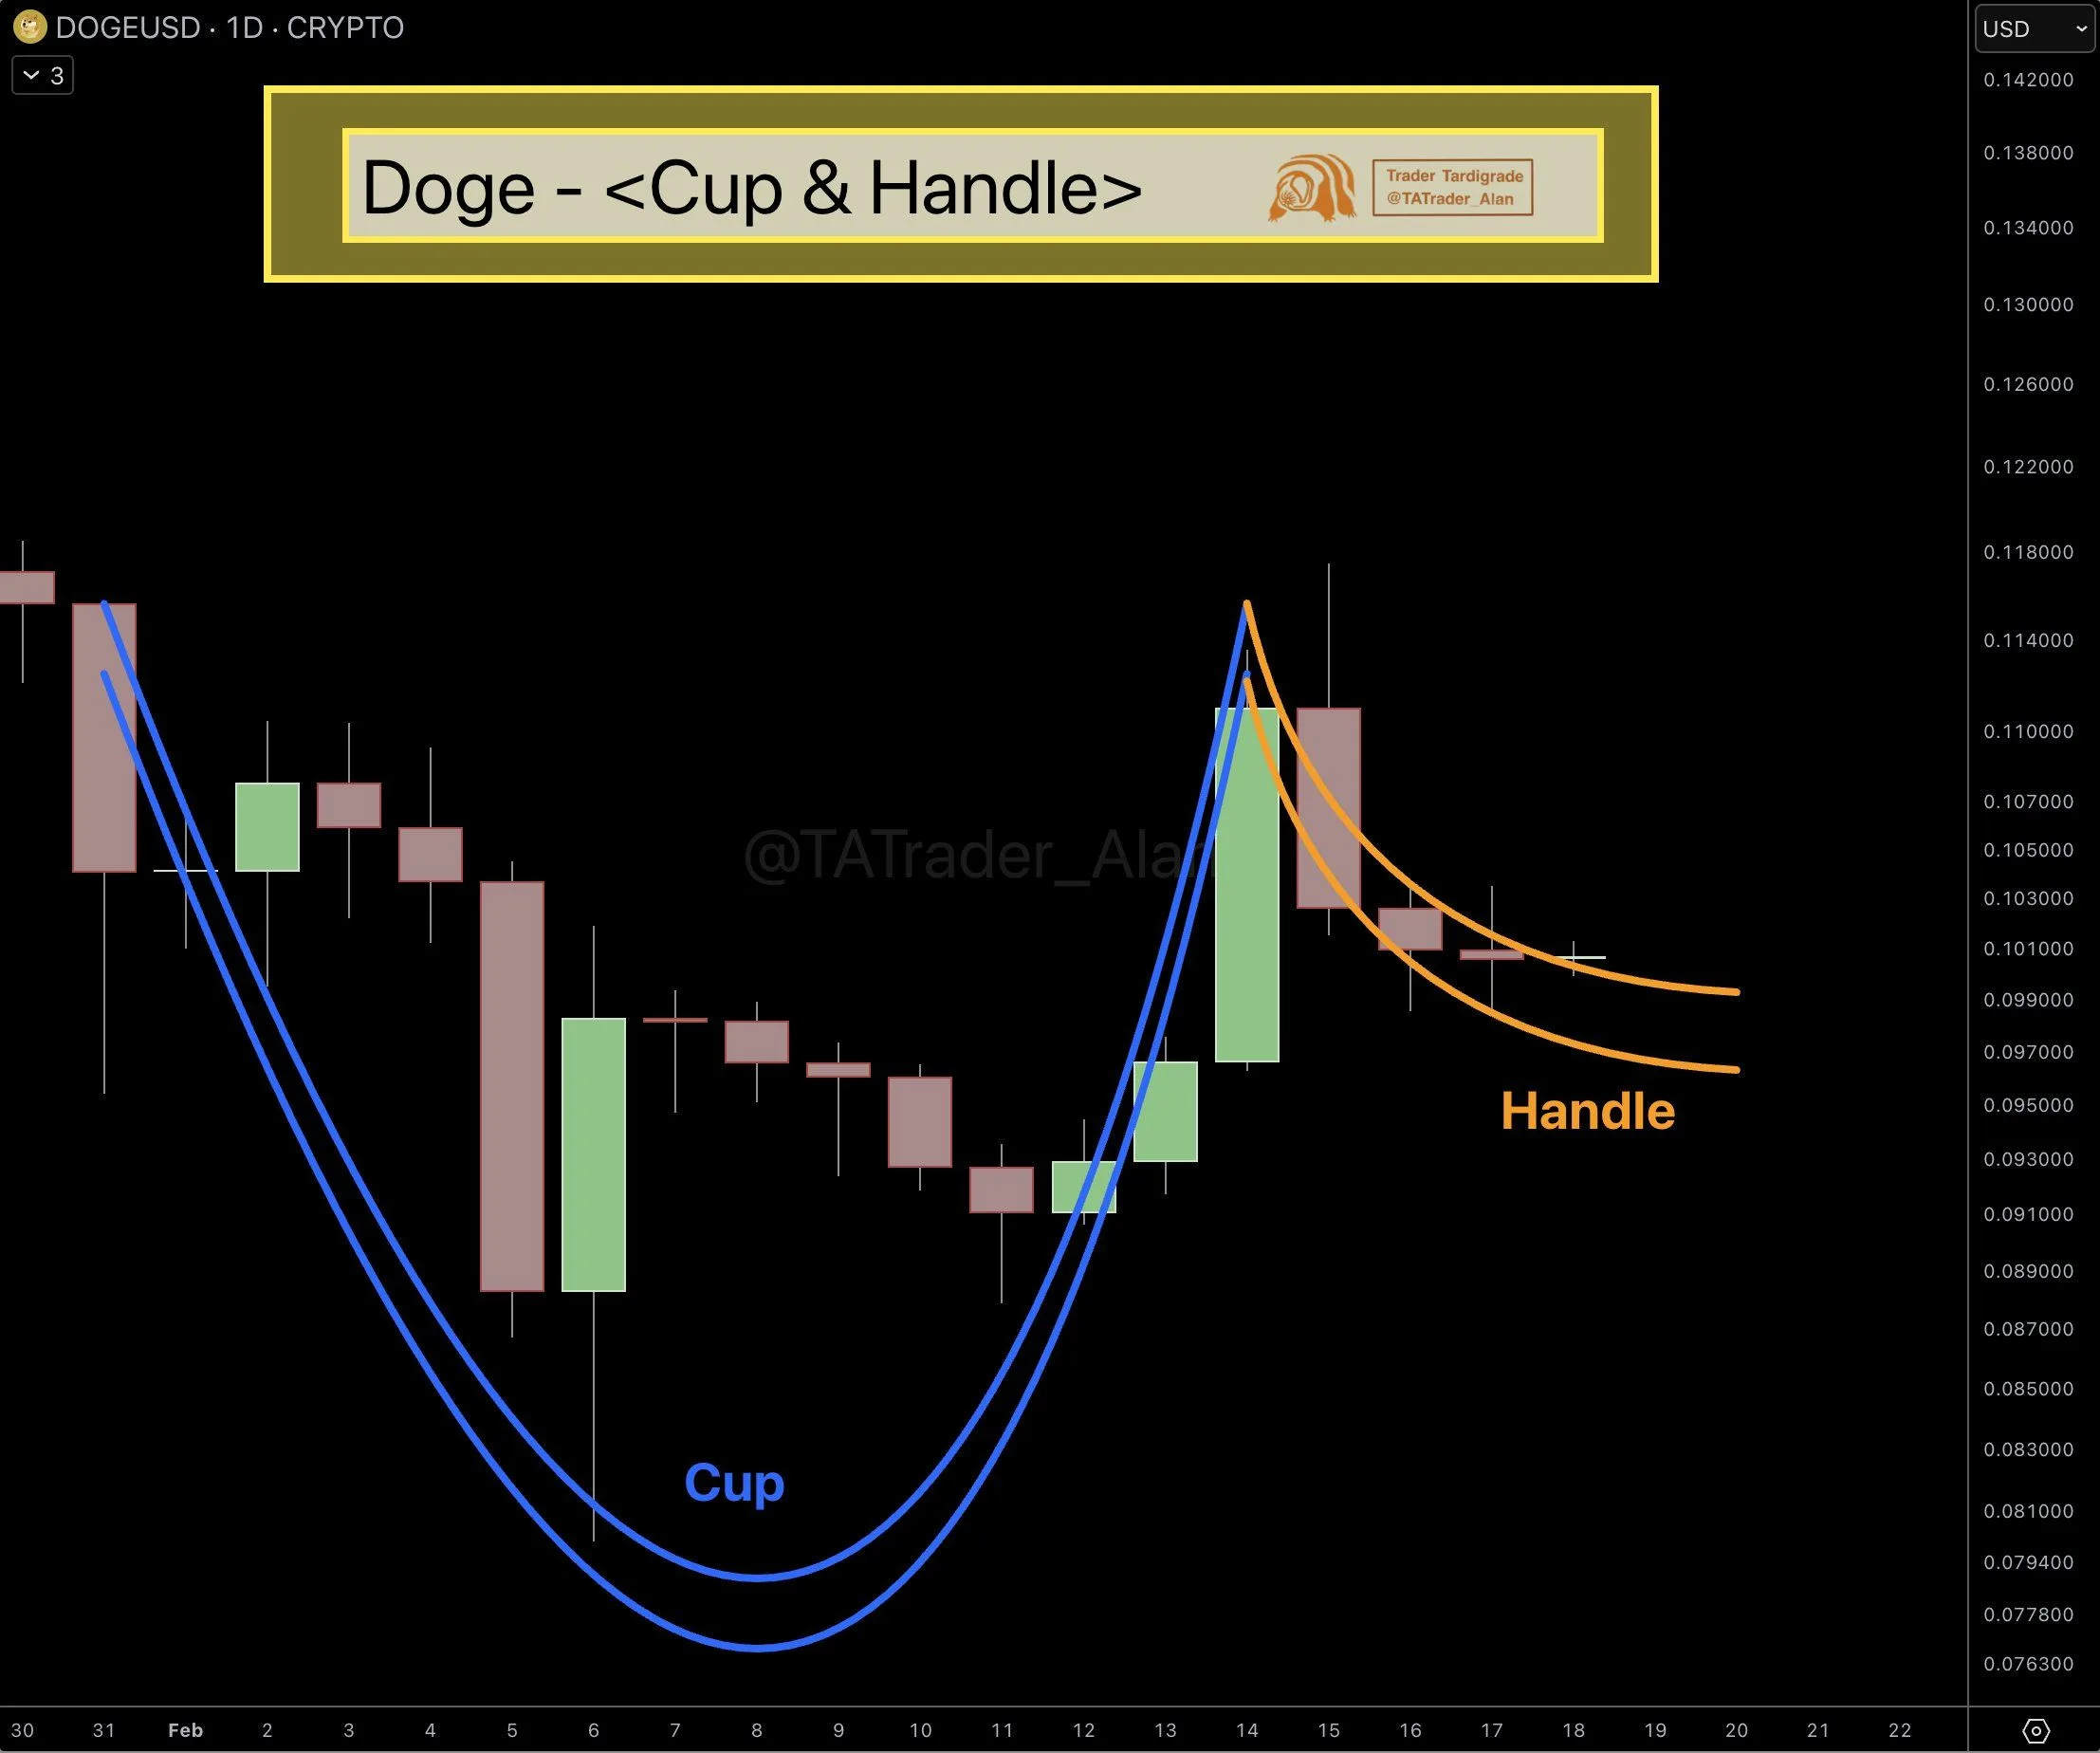
The critical moment will come if DOGE breaks above the handle’s resistance zone. A confirmed breakout could propel the token toward new highs, according to Trader Tardigrade. However, the pattern remains unconfirmed until that breakout occurs with sufficient volume. Without it, the setup is speculative.
News#Dogecoin #Price #Drops #Analyst #Spots #Bullish #CupandHandle #Setup #Daily #Chart1771496821