
Shiba Inu is trading at $0.00000617, down 5.34% in the past 24 hours. The session’s range $0.000006218 to $0.000006525 tells a clear story. Buyers attempted to hold higher levels early in the day but failed. Price has since drifted toward the bottom of that band, leaving SHIB in a vulnerable technical position.

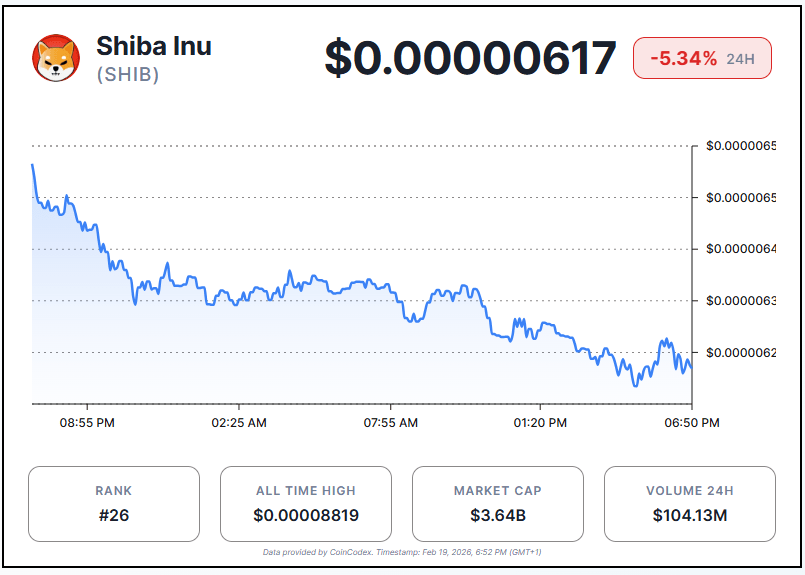
The short-term picture is mixed. SHIB gained 0.5% over the past seven days, suggesting brief recovery attempts are occurring. However, the 30-day loss of 21.4% confirms that any bounces remain shallow within a deteriorating broader trend. Bulls have not been able to build sustained momentum.
The central question now is whether SHIB can mount a credible recovery or whether sellers will continue to dominate price action at current levels.
Bollinger Bands Signal Caution for SHIB
On the daily chart, SHIB trades just below the middle Bollinger Band, currently near $0.00000638. This level is acting as immediate resistance. The upper band sits near $0.00000706, a target that remains distant given current momentum.
A sustained break below the lower band would expose SHIB to a deeper test near the recent swing low of $0.0000051. That level represents more significant structural support. Losing it would mark a notable deterioration in the technical outlook.
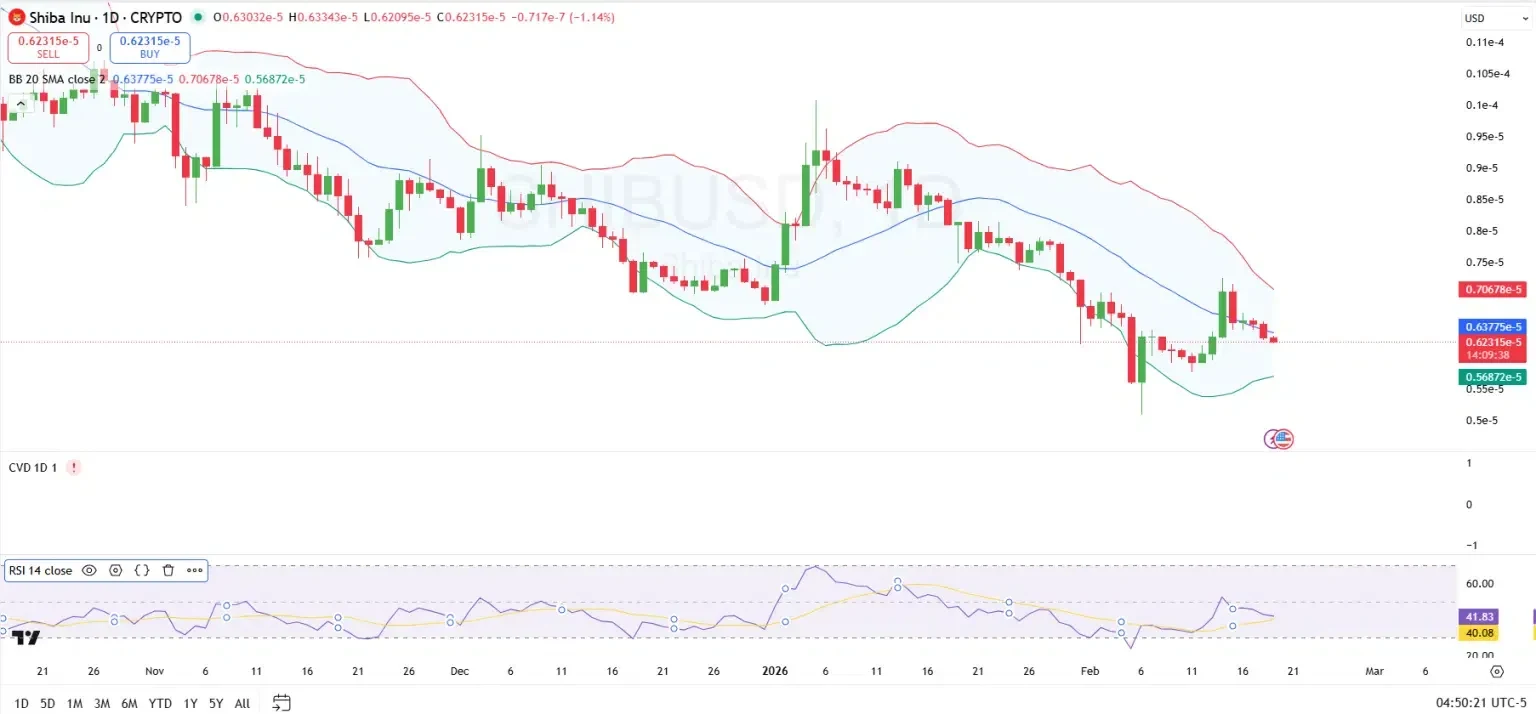
Repeated failures in the middle band confirm that sellers remain active on rallies. Each time SHIB approaches that zone, selling pressure has capped gains. For bulls to shift the narrative, price must reclaim the mid-band and hold above it on a closing basis.
Band contraction is also noteworthy. Narrowing Bollinger Bands indicates that volatility is compressing. This typically precedes a directional move. The direction of that breakout, once it arrives, will likely set the tone for SHIB’s next meaningful trend.
RSI and Open Interest Reflect Muted Market Confidence
The Relative Strength Index (RSI-14) sits between 41 and 42. This places SHIB firmly in weak-to-neutral territory. The reading is not yet oversold, which means a technical bounce driven purely by exhaustion is not imminent. Momentum remains tilted to the downside.
For bullish sentiment to gain traction, RSI must climb above 50 and sustain that level. Historically, reclaiming the 50 threshold signals a shift in control from sellers to buyers. Until that happens, the path of least resistance points lower.
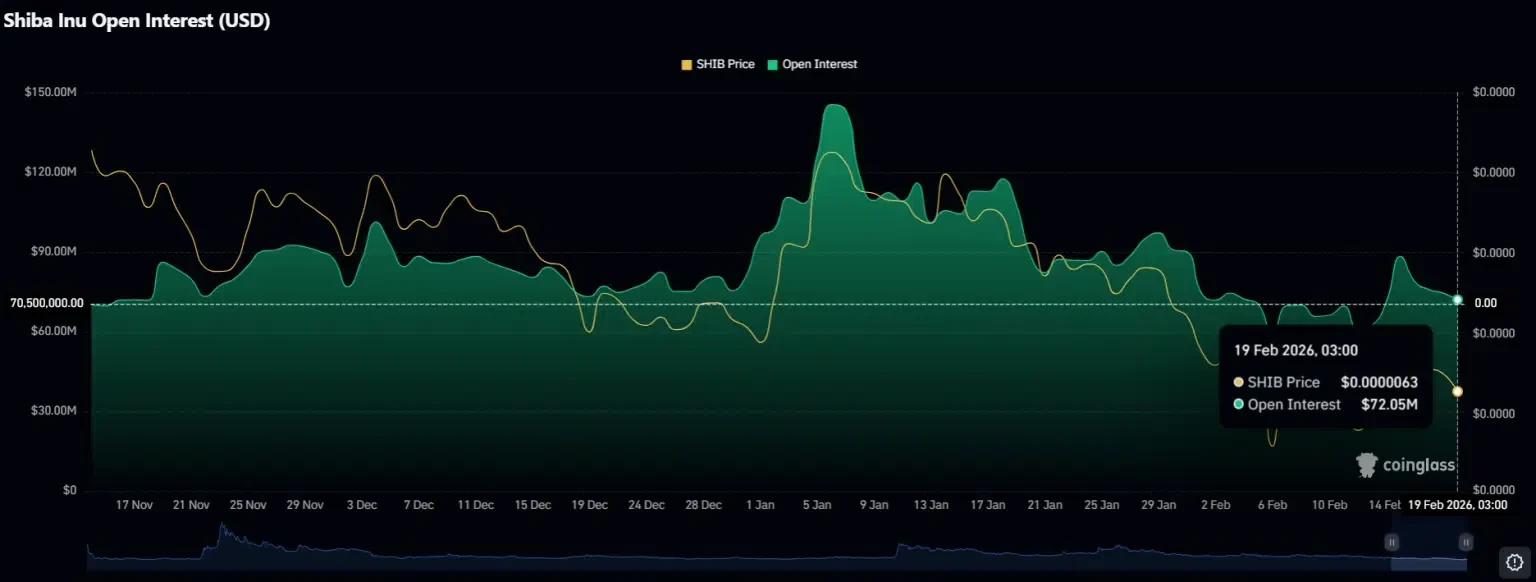
Open interest data adds another layer of caution. As of February 19, SHIB’s open interest stands at approximately $72 million. That figure is significantly lower than the early January peak above $140 million, when a strong price rally attracted leveraged positioning. The decline in open interest through late January and into February closely tracked the weakening price, a pattern consistent with long liquidations and reduced risk appetite.
News#Shiba #Inu #Price #Prediction #SHIB #Break #Stage #Recovery1771519279